|
|
| |
|
| |
|
These pages let you explore the sun at different times in the solar cycle, and using different frequencies of light (white, x-ray, h-alpha, and extreme ultraviolet). Read below for more information, or go straight to the interactives: SolarMax, SolarMin, Mid-Cycle. Contents
Seeing the Sun in Different Ways
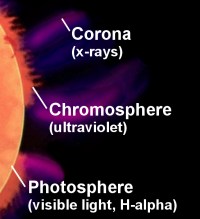
When you look at something, your eye interpretes different frequencies of light as different colors. But there are far more frequencies of light than your eye can see. Infrared, ultraviolet, x-rays and microwaves may not be visible to your eye, but we can see them with specially designed instruments, and use them to learn more about our world. On the sun, different frequencies of light are formed in different parts of the solar atmosphere. That means that if we filter the light so that we see only a particular frequency, we can see different layers of the sun's atmosphere. The visible layer of the sun's atmosphere -- the part that produces visible light -- is called the photosphere. Above that is the chromosphere, which produces ultraviolet light, and above that is the solar corona, which produces x-rays. At 1 million degrees F the corona is the hottest part of the solar atmosphere.
For more information on the the different frequencies of light used by these filters, and how they are formed, click here.
The Solar CycleLike Earth, the Sun has seasons. More precisely, it has a cycle that lasts about 11 years. During the peaks of this cycle, the sun is much more active, with many sunspots visible on its surface. Click on the dates to explore the sun near solar minimum, near solar maximum, or mid-way between minimum and maximum.
What You Need to View These PagesThese pages require a browser compatible with Java 1.2 or better. Reasonably current versions of Internet Explorer on the PC or Macintosh should be able to view them. Netscape may require the most recent version, especially on the Macintosh. These pages will need to load several images, so it may take some time to download over a modem. The applet will begin working before all the images are downloaded, so don't let that confuse you!
Some questions to ponder
|
||||||