|
| |
|
| |
|
This java applet lets you explore the sun using different frequencies of light: white (visible) light, x-ray, h-alpha, and extreme ultraviolet. You can also explore a magnetogram, which shows you the direction of the magnetic fields near the solar surface. The full disk image of the sun that you can see on the right is a white-light, or visible light image. Click on the buttons below it to select one of the filters, then drag the filter box around the sun to examine different parts of the solar disk. You must use version 4.06 or later of Netscape Navigator or version 4.0 or later Internet Explorer to view this applet. This applet also includes several images, so it will take some time to download over a modem. The applet will begin working before all the images are downloaded, so don't let that confuse you! |
About the filters
|
White light
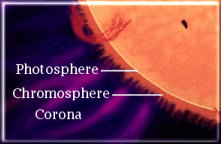
The full spectrum of visible light. This shows the photosphere, and is the image you see if you view the sun using a pinhole camera.H-alpha
H-alpha images are taken through a filter centered on a particular frequency of visible red light -- one of the spectral lines of Hydrogen. This light forms in the chromosphere, above the visible photosphere but below the corona.Extreme Ultraviolet
This frequency of light is also formed in the chromosphere. The particular frequency used here forms high in the chromosphere and in the lower regions of the sun's corona.X-ray
The X-rays we can see form in the outermost layer of the sun's atmosphere, the solar corona.Magnetogram
Certain frequencies of light are sensitive to the presence of magnetic fields. If we take a picture of the sun using those frequencies we can calculate the direction and intensity of the magnetic field near the solar surface. In the image used here the colors red and blue are used to indicate magnetic fields pointing toward and away from the solar surface.
Some things to ponder
- How do sunspots (the dark areas in the white-light image) look using the different filters?
- Do regions that look active in one filter always look active in another filter?
- Can you make any guesses about whether magnetic fields are important factors in solar activity?
- Look at the sunspots using the magnetogram filter. Can you guess why sunspots tend to appear in pairs or groups?
- You might notice that the different solar images are not perfectly lined up. The images start out at different sizes and orientations, and are scaled and rotated to line up as well as possible. In addition, though, the images were taken at somewhat different times, with up to a maximum of a few hour gap. The sun rotates once on its axis in about 27 days. How big a difference do you think this few hour difference makes?
